
General Tab
The current version of PetroVR is indicated by a label at the top of this tab. If the currently open model was last saved using a previous version of the software, this will be indicated between brackets. (See also Project Migration.)
The fields in the Project Info pane provide three lines of descriptive text for a model. These lines will be used as headers in all Excel Reports.
 Signatures: Open the Model Signatures window.
The Project Description textbox allows a detailed description of the model. A toolbar with options to use different formats is displayed while you are editing the description:
 Bold.
Bold. Italics.
 Underline.
 Text color.
 Highlight.
 Align left,
  Center,
  Align right.
 Bullets.
 Undo,
Undo,  Redo.
Redo.
A non-editable copy of the Surface Layout is displayed next to the description box. At first this is the input layout from the Surface Layout Tab; after each simulation run, it is replaced with a copy of the simulated layout from the In Last Simulation tab (Surface Layout).
Use the Report Periodicity and Simulation Span pane to manage the time span of the simulation and the granularity of reports. Report periodicity does not affect the simulation as such, but is used mostly in the generation of Results, Graphs and Reports. See further under The pulse of the simulation.
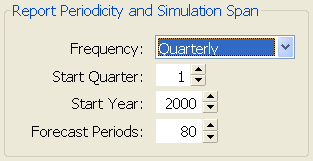
Frequency: Define the extent of the periods to be used for generating reports.
- Years: Enter the Start Quarter and Start Year, and the number of Forecast Periods. This is the only option where a period may span over different calendar years, if the Start Quarter
- is other than 1. Semi annual: Enter the Start Semester and Start Year, and the number of Forecast Periods.
- Quarters: Enter the Start Quarter and Start Year, and the number of Forecast Periods.
- Months: Enter the Start Quarter and Start Year, and the number of Forecast Periods.
- Mixed: Use this option to generate reports from higher to lower granularity. Enter Start Year, and in the Periods sub-pane the number of Months, Quarters, Half years and Years. Periods shorter than a year must add up to whole years (i.e., 12, 24, 36 months, 4, 8 quarters, etc.) and will be rounded up if necessary. To omit an input, enter 0 (zero).
Start Quarter / Semester: Part of the year the simulation starts (always on Jan, Apr, Jul or Oct 1st).
Start Year: First year of the simulation.
Forecast Periods: Number of periods to be covered by the simulation. After the last day of the last period the simulation stops, even if there are jobs in progress or wells and facilities producing.